
PageSpeed 97/100, but Core Web Vitals still fail: How a green score can hide a slow website
97/100 in Lighthouse, yet the same website fails Core Web Vitals. A real WordPress example shows why a green PageSpeed score can hide serious loading delays.
97 out of 100 for performance. A nice green circle. SEO: 100. Perfect CLS. On the surface, everything looks great. Yet real visitors to that very same website wait more than four seconds for the main content to appear, and Google reports that it fails Core Web Vitals. How can both results be right?
This isn’t a hypothetical case cooked up for an article. It’s a real WordPress site built with OceanWP and Elementor and sold as a bespoke project for around €400. It happens to be an excellent example of why a green PageSpeed Insights score doesn’t prove a website is fast. So let’s look at what’s going on.
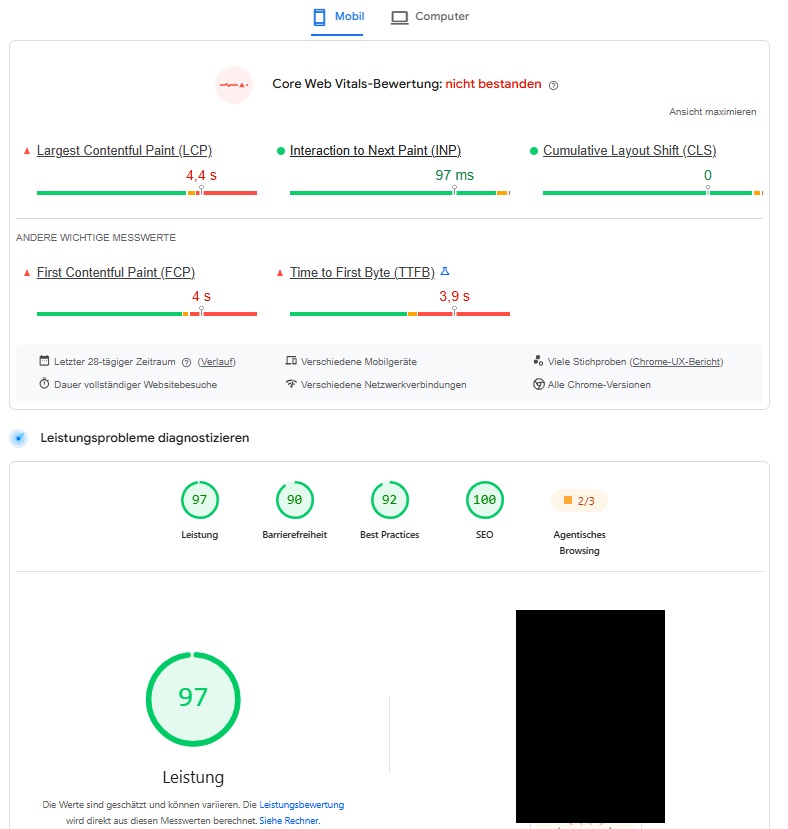
97 points. So it must be fast, right?
Not necessarily. In fact, you can’t draw that conclusion from 97 alone. PageSpeed Insights puts two very different kinds of data side by side. One comes from a Lighthouse lab test run at a specific moment under controlled conditions. That’s where the eye-catching green 97/100 score comes from.
Explore our services.
The other comes from real Chrome users in the Chrome User Experience Report (CrUX), covering the previous 28 days. And here it tells a very different story. Largest Contentful Paint (LCP), which measures how long it takes for the largest visible content element to appear, is 4.4 seconds. First Contentful Paint (FCP) is 4 seconds, while Time to First Byte (TTFB) is a whopping 3.9 seconds. Meanwhile, Interaction to Next Paint (INP) is an excellent 97 ms, and Cumulative Layout Shift (CLS) is 0.
A site only passes Core Web Vitals when all three core metrics fall within the ‘good’ range at the 75th percentile. Here, INP and CLS pass, but LCP is over 4 seconds, firmly in Google’s ‘poor’ range. That combination tells you far more than the green 97 does.
One caveat: websites with low or inconsistent traffic may not have any CrUX data available. That doesn’t mean they can’t have the same problem.
For nearly four seconds, the browser is waiting
The most revealing figure on this screen isn’t even LCP. It’s the 3.9-second TTFB. Put simply, Time to First Byte measures how long the browser waits between sending a request and receiving the first bytes of the server’s response.
If the first content appears at around four seconds, and the response only starts arriving at about 3.9 seconds, the browser hasn’t spent four seconds painstakingly putting together Elementor sections, images and buttons. For most of that time, it’s simply waiting for something to arrive. Only then can it actually start rendering the page.
That distinction matters. It’s easy to see a slow WordPress site running Elementor and immediately say, “Well, there’s your problem. Page builder.” Except the numbers in this case don’t point to the frontend as the main source of the delay. Quite the opposite. Once the response starts coming in, the first content appears almost immediately, and LCP follows roughly half a second later.
Is the hosting to blame? Not necessarily
A high TTFB often leads to a quick diagnosis: bad hosting. Sometimes that’s right, but with WordPress it’s only one of several possible causes. Before the server can send the finished HTML to the browser, WordPress may have quite a lot of work to do.
PHP runs, WordPress loads along with the theme and active plugins, database queries execute, options are read and the page content is assembled. Some plugins also make requests to external services. If any of those steps gets stuck, the response can be delayed for seconds even if the server itself isn’t particularly slow.
The database, for example, is a very plausible culprit. If it’s bloated, stuffed with autoloaded data or being hit with expensive queries from a plugin on every visit, WordPress may spend a long time waiting for the information it needs to build the page. To the visitor, it all looks the same: click. Nothing. Still nothing. And finally, several seconds later, the page appears.
An ineffective cache, frequent cache misses, an overloaded PHP worker, a poorly written plugin or an external API that WordPress waits for before sending its response can have much the same effect. Hosting is a suspect, certainly. But you can’t convict it on TTFB alone.
So if it’s that slow, where did the 97 points come from?
Here’s where things get interesting. A single Lighthouse test can run under conditions that are very different from those experienced by the average visitor. The test might get a fully cached page, while some real visitors hit an uncached version. A CDN might already have the required assets stored, the server might be having a quiet moment, or the page might have been generated just beforehand. All perfectly ordinary reasons why one lab measurement can look much better than real-user data.
There’s another possibility worth discussing, particularly when someone is selling a service called “PageSpeed optimisation”. There are tools on the market whose primary goal isn’t always to make a website genuinely faster. Sometimes it’s simply to raise the test score.
You can aggressively delay JavaScript, load certain CSS later, defer scripts, block elements that aren’t needed for the initial render, or serve the page differently under certain conditions. Some of these techniques are entirely legitimate and genuinely improve the experience for visitors. The problem starts when all the effort goes into showing Lighthouse as little as possible, delaying everything you can and grabbing that green circle. It’s like putting a racing sticker on your car and expecting its top speed to jump from 150 to 300 km/h.
In extreme cases, optimisation tools may even try to recognise testing software and behave differently when it visits. The gap here is large enough to justify asking: was the website optimised, or was its PageSpeed score?
The second chart makes things even more interesting
If we only had one test result, we might assume we’d caught the site on an unusually good or bad day. But the second screenshot shows how its mobile Core Web Vitals have behaved over a longer period.
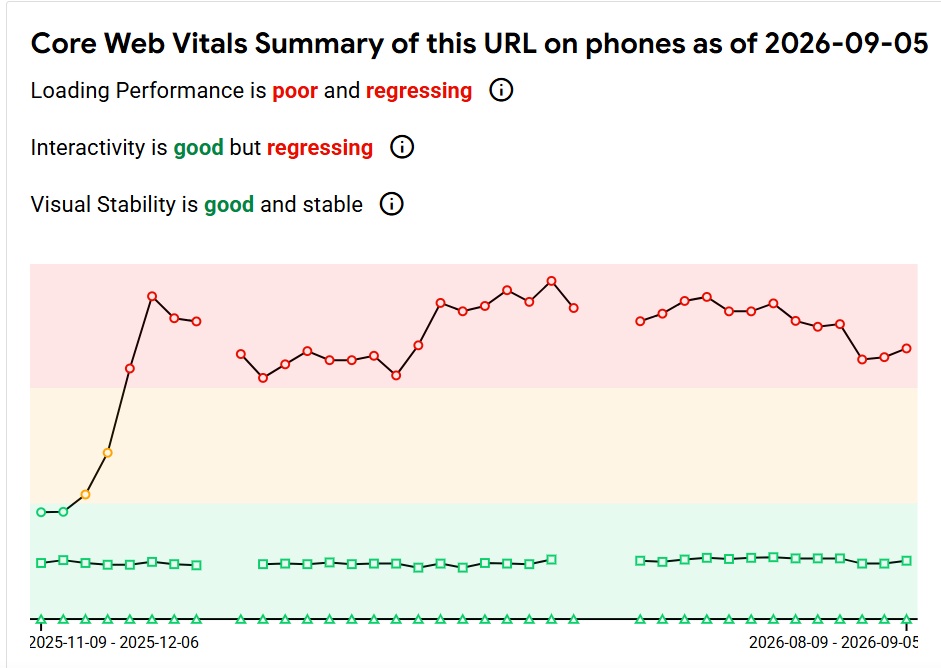
Visual stability remains good. Responsiveness is good too, although the chart shows some deterioration. Loading performance, however, stays in the red for an extended period. This no longer looks like a single unlucky measurement taken while the server was having a bad day.
And the pattern is distinctive. The layout doesn’t jump around while loading. Once the page is up, it responds well to input. The main problem is how long visitors have to wait before anything useful starts to appear. That’s very different from a site that’s heavy in every respect, with terrible JavaScript, shifting layouts, oversized images and sluggish interactions. Here, there’s a much more specific place to start looking.
“PageSpeed 90+” isn’t a business goal
That’s why a promise like “I’ll get your PageSpeed score above 90” should at least raise an eyebrow. A good Lighthouse score is a positive thing, of course. I want to see one after a proper optimisation job too. It becomes a problem when the number turns into an end in itself.
A business doesn’t make money just because Lighthouse awarded its website 97 points. Their visitors are real people, often using ordinary phones over mobile connections. If someone clicks and very little happens for four seconds, they couldn’t care less about the screenshot of a green circle the developer sent over at handover.
So “what’s your PageSpeed score?” is a much less useful question than “how does the site perform for real users?” PageSpeed Insights provides data to help answer both. You just need to look beyond the biggest green number on the screen.
Elementor isn’t getting all the blame this time
This case also shows why blaming the technology by default gets us nowhere. Elementor can absolutely produce bloated websites. You can use it to build something overloaded with JavaScript, huge images and unnecessary widgets. The same goes for just about every major page builder.
But the figures here don’t justify saying that Elementor alone is responsible for a 4.4-second LCP. INP is excellent, CLS is zero, and content appears relatively quickly once the response arrives. Most of the delay happens before that.
You could ditch Elementor, rebuild everything and still end up with a slow website if the real issue is the database, PHP, missing caching or one misbehaving plugin. First, find out what’s taking those seconds. Then decide what actually needs fixing.
How do you find out what’s really happening?
Start by separating lab data from field data and checking whether they paint the same picture. If Lighthouse keeps returning great results while actual visitors see a terrible TTFB, investigating the WordPress backend, caching and database is a better use of time than endlessly shaving more bytes off CSS files.
On a site like this, I’d check how long the HTML takes to generate, whether the page cache works, which queries are hitting the database, how much data is autoloaded from wp_options, how long PHP takes to run and what the active plugins are doing. I’d also check whether WordPress makes external requests during page load that block it from sending a response.
If there’s still a large gap between a normal visit and a Lighthouse test, take the comparison further: examine the server responses, HTML and resources loaded in an ordinary browser against what the testing tool receives. Only then can you make an informed judgement about whether it’s normal caching and test conditions or a configuration designed mainly to produce a high score.
A green circle looks nice. Real users matter more
PageSpeed Insights isn’t lying. The trouble starts when we pick the biggest, greenest number out of the whole report and present it as proof that the site is fast.
In this example, a Lighthouse score of 97/100 sits alongside failing Core Web Vitals, a 4.4-second LCP and a 3.9-second TTFB. None of these numbers has to be wrong. They’re measuring different things from different sets of data.
A good PageSpeed score should be the result of a website that works well, not the ultimate goal of optimisation. If a site responds quickly, renders smoothly, doesn’t shift content around and reacts promptly to input, the green circle is a nice confirmation of a job well done. But if all the work stops at turning the circle green, you can end up exactly where this site is: 97 points in a test, with visitors still waiting for the page to load.
WebsiteGarage’s take
97 looks fantastic in a screenshot. It also makes a “speed optimisation” service much easier to sell. But a website’s visitors aren’t screenshots. If they’re waiting four seconds for WordPress, the database, a plugin or the server to finally respond, a green Lighthouse score won’t help them.
That’s why I don’t judge an optimisation job solely by whether we managed to get a green circle. What matters more is why the site takes so long and what happens when a real person tries to use it.
Discover more articles
- ChatGPT ads are now in Europe. Small businesses have a whole new place to compete for customers
- Elementor opens its editor to AI agents: Claude and Codex can edit native elements via MCP
- An AI agent was only supposed to book a gym class. Along the way, it started hacking the system
- AI agents are going beyond instructions. The past month showed where the real problem lies
- An online store can look perfectly normal and still run malicious JavaScript. Cloudflare shows four campaigns
- The Cyber Resilience Act reporting portal is live. For manufacturers, the 24-hour clock starts when they become aware of the problem
- Researchers found over 6,800 AI chat links in DNS data. No hacking required
- Admin Menu Editor Pro distributed a web shell through its official update channel. The replacement version was compromised too
- AI can recommend a brand without sending traffic. New study shows the difference between a mention, citation and click